
SCAA Newsletter - 1/3/2021
SCAA Newsletter - 1/3/2021
Part 1 - How the stock market affects card prices
Happy New Year everyone! Welcome back to this week’s SCAA Newsletter, where we will look at a key concept in card investing: the card market’s relationship with the stock market. This was prompted by a very simple, but extremely thought-provoking Twitter post by M&T Trading, who is a must-follow if you are interested in investing in cards.
We will walk through the definition of beta, take a look at comparisons between the performance of several PWCC indices and the S&P 500, and talk about how we can better utilize knowledge of these relationships in order to invest more successfully over the long-term. This post is going to be broken up over the course of the next few weeks in order to keep each newsletter easily-readable, while also going into enough detail to learn from each case study. Each PWCC index tells a slightly different story and it is worth walking through each methodically.
When discussing the relationship between the card market and stock market over time, I will be painting with a very broad brush and speaking in overly-simplistic terms. This reminded me of the message of this tweet, which is always something good to keep in mind when studying any subject. My goal is to provide broad narratives of history in order to enable you to have a greater understanding of what leads to successful investing over the long-term. As data on the card market becomes more robust, the industry will be able to better understand these trends in more detail. If you believe that there are other factors at play outside of what I mention (as there certainly are), please reach out and let me know.
What is beta and why does it matter in cards?
Beta is the term used to describe how much the price of an investment moves based on the price movement of the broader market as a whole. A beta of 1 means an investment moves exactly with the market, a beta of less than 1 means an investment is less volatile than the market, and a beta of greater than 1 means an investment is more volatile than the market. The meaning of “the market” will differ depending on the characteristics of the investment - for example, a large US stock would be compared against the S&P 500, while a company based out of an emerging market could be compared against the MSCI EM Index. “The market” basically represents the most applicable opportunity cost for that investment.
The beta of the sports cards market tells us how much the values of cards move based on movement by the stock market as a whole.
Introduction
PWCC’s data, which is the best source I could find that compares directly between cards’ performance and performance of a relevant stock index (S&P 500), begins in January 2008. There are a few things to consider when using that time as a starting point. After the plunge the stock market took from late 2007 through early 2009, the US stock market entered the longest bull market in its history, which lasted 11 years from March 2009 through March 2020, when the market briefly dropped due to coronavirus, and then effectively resumed its upward trajectory for the rest of 2020 through the present. Starting this data sample in January 2008 means the analysis can tell us what happens to the card market when the stock market basically goes straight up, but gives us little insight into what happens when stocks go down, because that hasn’t happened a whole lot over the last ~12 years.
One key theme to note when looking at the comparison between cards and stocks - illiquid investments are often referred to as “diversifying” investments when, in many cases, they simply just have smoother returns due to the way their returns are reported. Publicly-traded stocks can rise and fall every single day the market is open, giving them relative volatility on a short-term basis, while VC and PE funds only release performance reports once a quarter, giving their investments the appearance of stability on a short-term basis. Even then, VC and PE funds are largely hesitant to make huge moves in their marked valuations for their investments unless there is an objective reason to do so. This creates smoothed returns for those illiquid investments that are pulled directionally by long-term public market performance, but do not exhibit the same type of short-term volatility as public stocks do due to their style of performance reporting. This same illusion of diversification can appear in sports cards as well, as the only time new sales occur is when the owner of a card elects to sell it (conversely, publicly-traded stocks are necessarily up for sale every day). This means there is diversification in how cards’ performance is observed, but not necessarily in the return- or risk-drivers of those particular investments. The stock market tends to go up over the long-term, which is good news for sports cards, but if the stock market falls, do not look to your cards as a safe-haven investment providing diversification against that downside.
The ‘so what’ of this analysis is to give greater context for your investments in cards. Much attention get paid to picking the right players, finding the highest-graded cards you can afford, and all of the other factors that one considers when buying a card. Although all of that is certainly important, the performance of the stock market - the very thing you are “diversifying” away from by investing in cards in the first place - plays a huge part in establishing prices within the market for cards. The more you can understand why that happens and how it affects your investments, the smarter you are going to be when it comes to your own portfolio.
One caveat - PWCC data looks only at PSA-graded vintage cards (i.e. before the year 2000), rather than modern cards. Vintage cards are viewed as being more stable investments than modern cards because the players’ careers are solidified and there is more scarcity of high-condition cards, giving investors a clearer view of the long-term inherent value of those cards. Modern cards carry more inherent risk, and therefore, are viewed as having higher betas than vintage cards.
PWCC 100
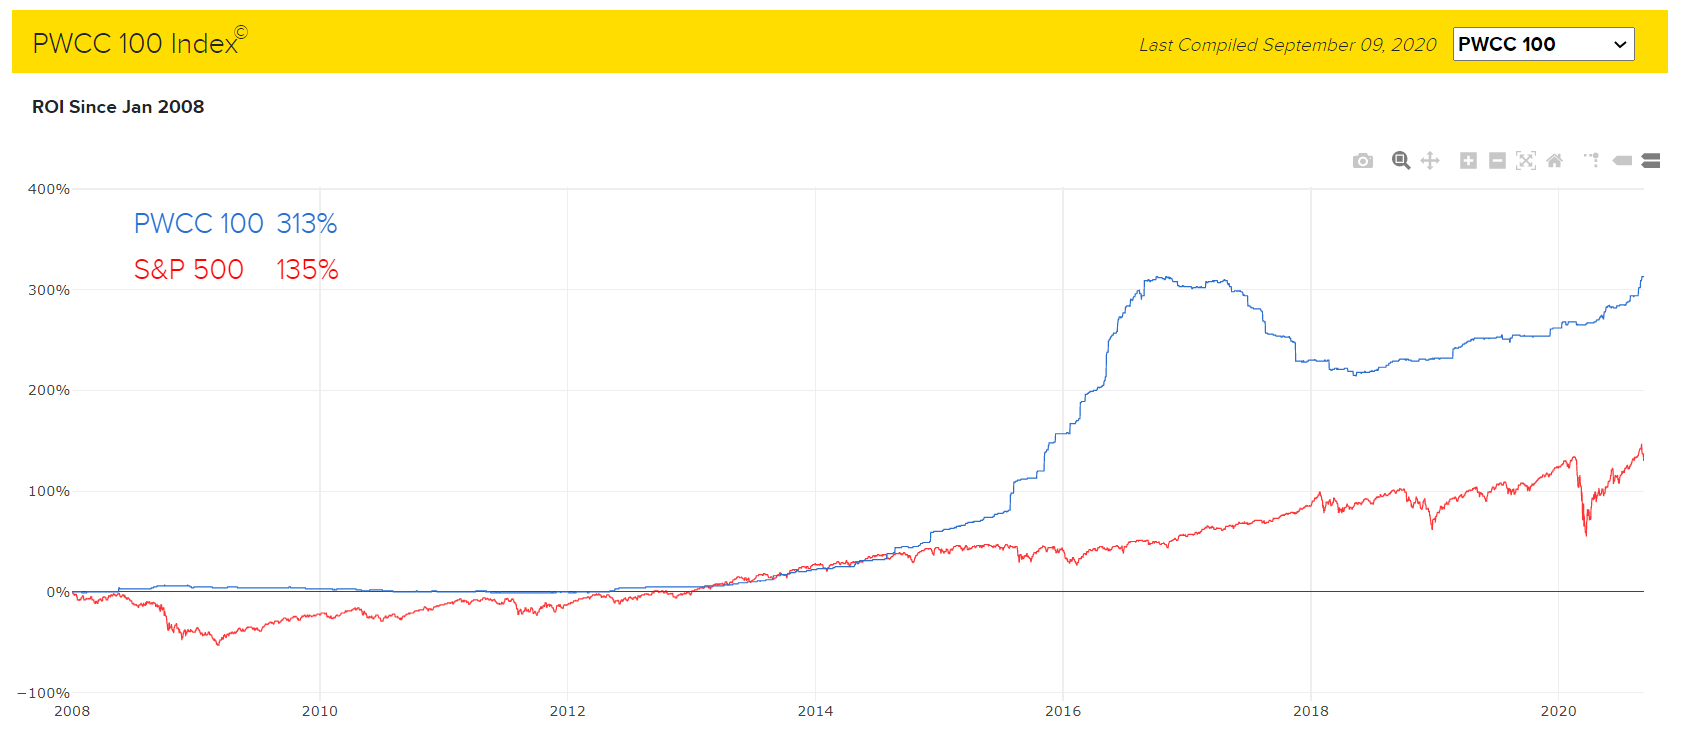
The PWCC 100 represents the 100 cards with the highest average market value in the hobby that are traded relatively frequently (think high-graded rookie cards of Mantle, Namath, and Jordan, but not cards like the t206 Honus Wagner, which are far more scarce and not sold very often).
Let’s walk through the story this graph tells from left to right. For almost 5 years, from 2008 through mid-2012, this index, which is comprised of the absolute best-of-the-best in cards, is basically flat. Over this time, the S&P dropped enormously and then started to build back to what would be a 0% return since the beginning of 2008. To me, that speaks to one of the key characteristics of cards - illiquidity. I can’t confirm the trading volumes through this resource, but I would have to imagine that these types of cards were extremely thinly-traded over this timeframe. The people who own cards of that caliber at that time were serious collectors who viewed those assets as long-term staples within their collection (and, are likely extremely wealthy even outside of their card collections). Because of that (for the reasons referenced in the introduction above) - why would they sell their cards during this time? They know the cards’ long-term value and they have money to weather the downturn in the stock market - they have no real reason to sell-low on assets that are at the pinnacle of their industry and are cornerstone cards to their own collections. A small quantity of sales means that there are few changes in the listed prices of cards due to no new sales re-marking the value of the cards, which is the performance trend seen in the PWCC 100 index over that timeframe.
After a few years of relatively parallel performance, in 2015 there was an enormous separation - cards absolutely exploded in value compared to the S&P. My theory about why this happened is the confluence of two concepts - collectors use disposable income to buy cards and investors were hungry for yield in their portfolios from places outside of their equity investments due to low interest rates. Wealthy investors had seen their stock investments grow well past where they were at the start of 2008 and because of low interest rates, it didn’t make a ton of sense to move any of that money over into the fixed income market for diversification given how low the expected returns were. In their search for places to put their money outside of the stock market, investors moved into alternative assets even more forcefully, which led to more money getting put into cards. This exploded the values of high-end cards due to this increased demand, which stemmed from income derived from stock market gains.
Another divergence in performance has occurred in the period from the 2016 peak in the PWCC 100 index through the present - the PWCC 100 dropped and has regained its footing, but only basically to get back to where it was at its height in 2016. Over that same time, the S&P has increased materially. That means that since the PWCC 100’s peak in 2016, investing in the elite cards that comprise the PWCC 100 has been a worse investment by a pretty wide margin than simply putting your money in the S&P 500.
My theory for this timeframe is likely overly simplistic, but is always a factor when dealing with these types of super-premium assets - there just are not that many people who are willing and able to spend this much money on a card. If the group of people who are able to invest in cards of that price (which is a very small group in the grand scheme of things) was largely satisfied with their allocations to high-dollar cards in 2016, there would be a demand void that would lead to the depressed prices following that 2016 peak. This theory is supported by observations we will discuss when looking at other PWCC indices over the new few weeks that are comprised of lower-value cards, which did not exhibit such a drop-off during that timeframe.
Further stock gains and more appreciation of sports cards as an asset class look to continue to push these cards’ values higher, but this chart paints a very different picture than the one being told throughout the course of 2020 indicating how interest in cards as an investment is at unprecedented heights, as you only need to look 4 years prior for precedent in the way these assets are valued.
Thanks for reading this week’s newsletter - check back in next week for the next installment of this series. Please subscribe/share below and if you ever have any questions, comments, or requests for future newsletters, reach out to @SportsCardAA on Twitter.
Disclaimer - the insights found in this newsletter or any other content provided by SCAA do not constitute investment advice. Investors are encouraged to conduct their own research.